Of all the software I’ve developed in my career, one project stands out above the rest—the 3D Visualizer I’m building at Buildcode. It’s an advanced, online 3D BIM model viewer packed with features I never imagined I’d work on.
What makes programming so rewarding is the diversity of challenges it brings. Every problem is unique, presenting new shapes, forms, and complexities—but with persistence, no task is insurmountable.
You’ve probably heard of Laravel, Bootstrap, or THREE.JS. But what about XState? Yeah, me neither—at least not until I started working on this project.
In this post, I’ll walk you through what a 3D Visualizer is, the programming concepts behind it, and the uncharted territories I’ve explored along the way. Let’s dive in!
Prologue
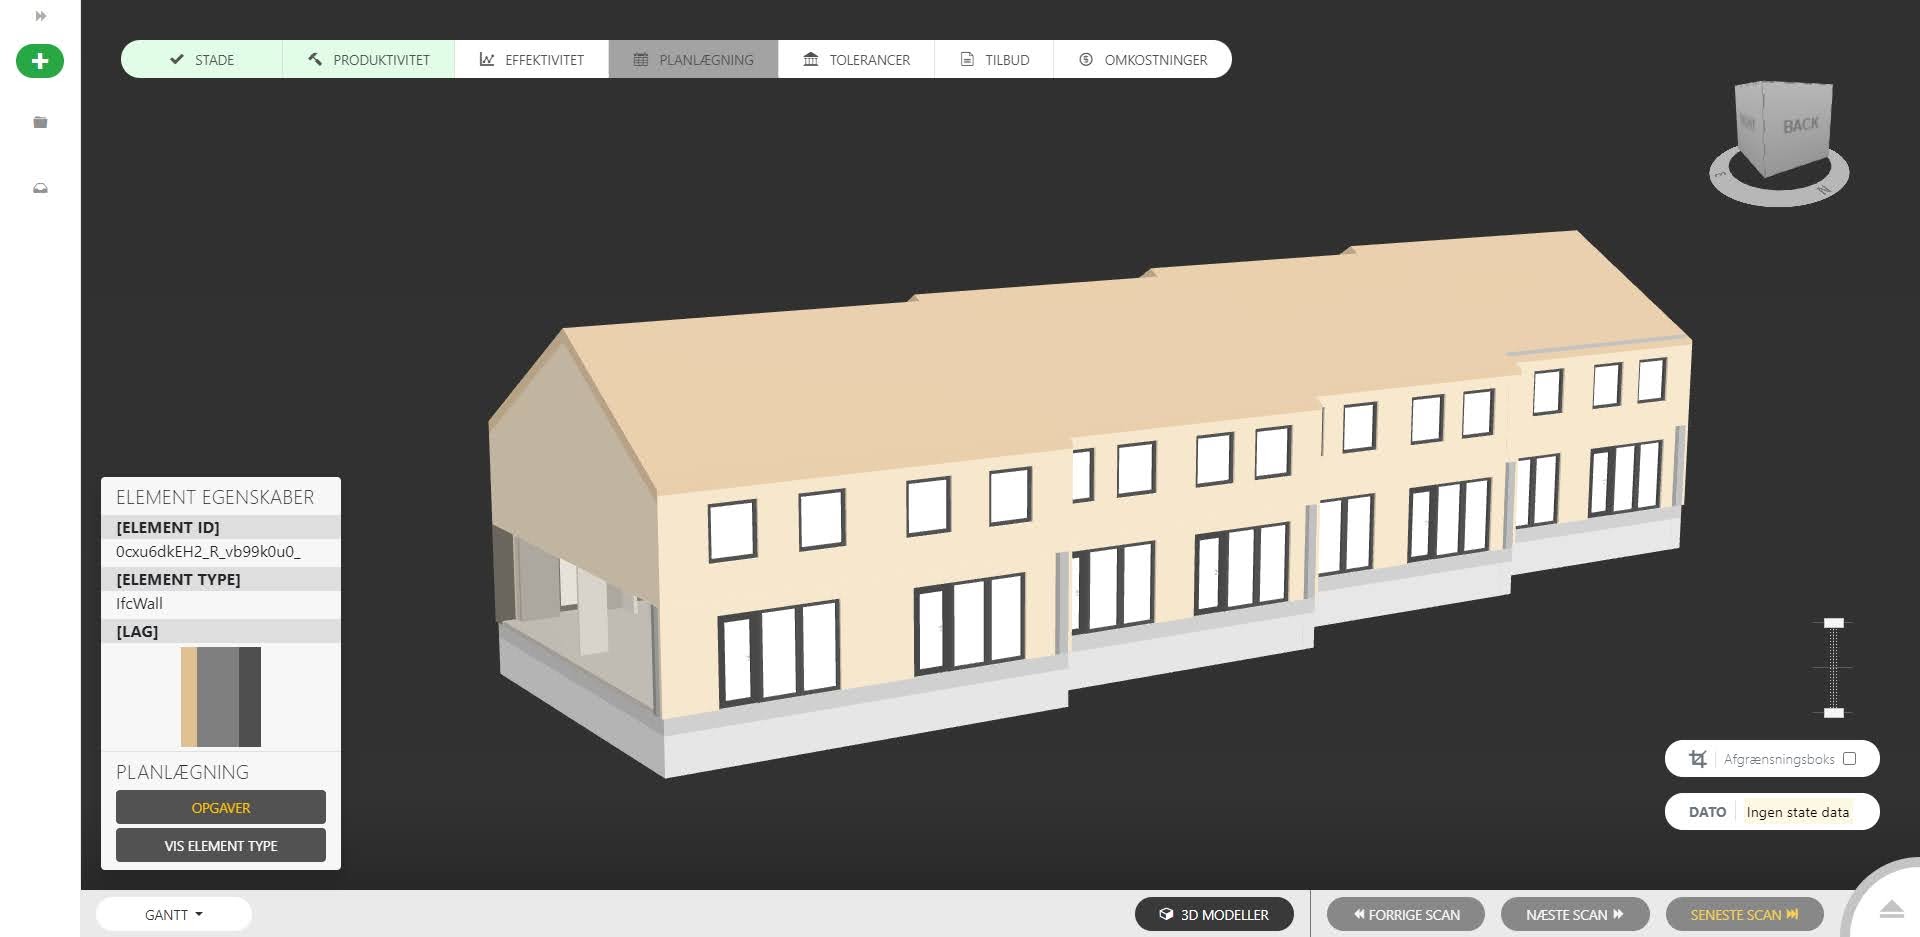
I’ve been working at Buildcode for some time now. A startup specializing in software for the construction industry—a field ripe for digital transformation compared to other sectors. These uncharted waters offer immense opportunities for innovation and growth.
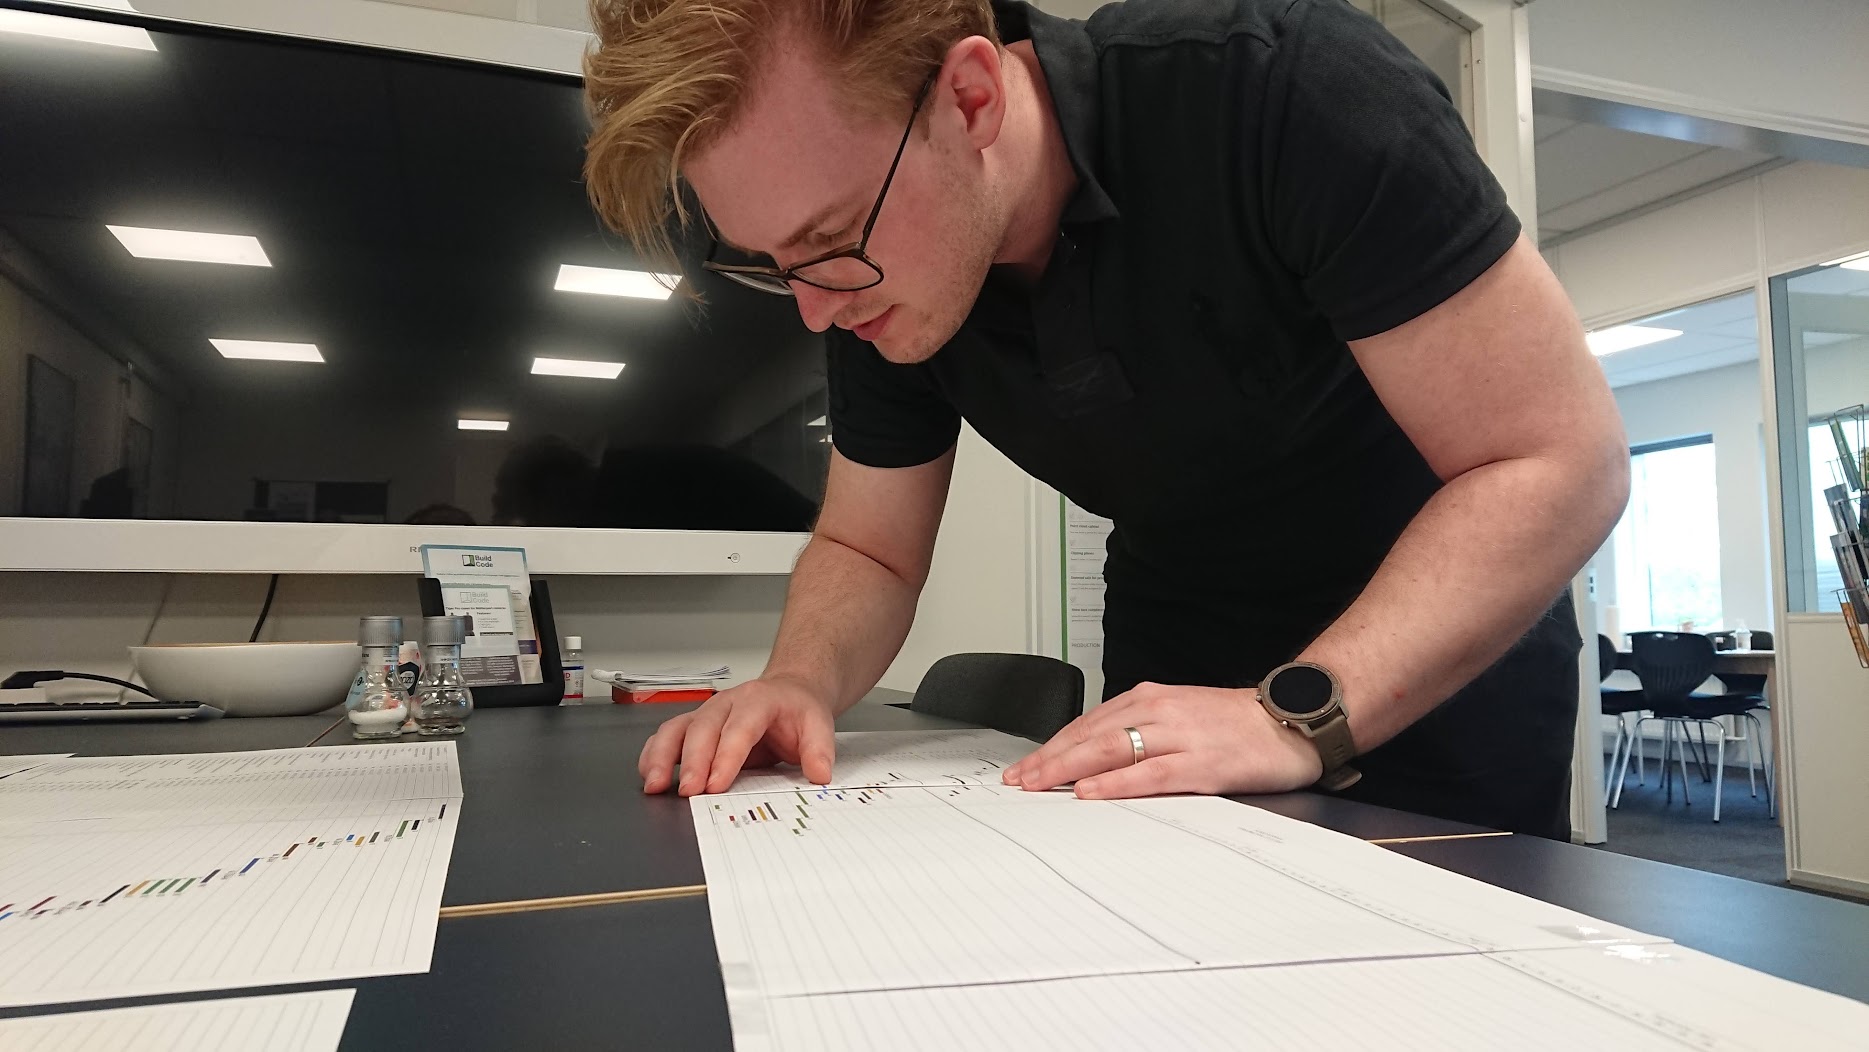
The idea for the 3D Visualizer began, like many ambitious projects, on paper. It was conceptualized and remained dormant until I joined Buildcode as an intern. That’s when the foundations of what is now Sitemotion started to take shape.
Sitemotion: The 3D Visualizer
Sitemotion is Buildcode’s online platform designed to simplify and elevate construction workflows. It offers an array of powerful tools, from drone scans and façade measurements to VR inspections and remote video analyses.
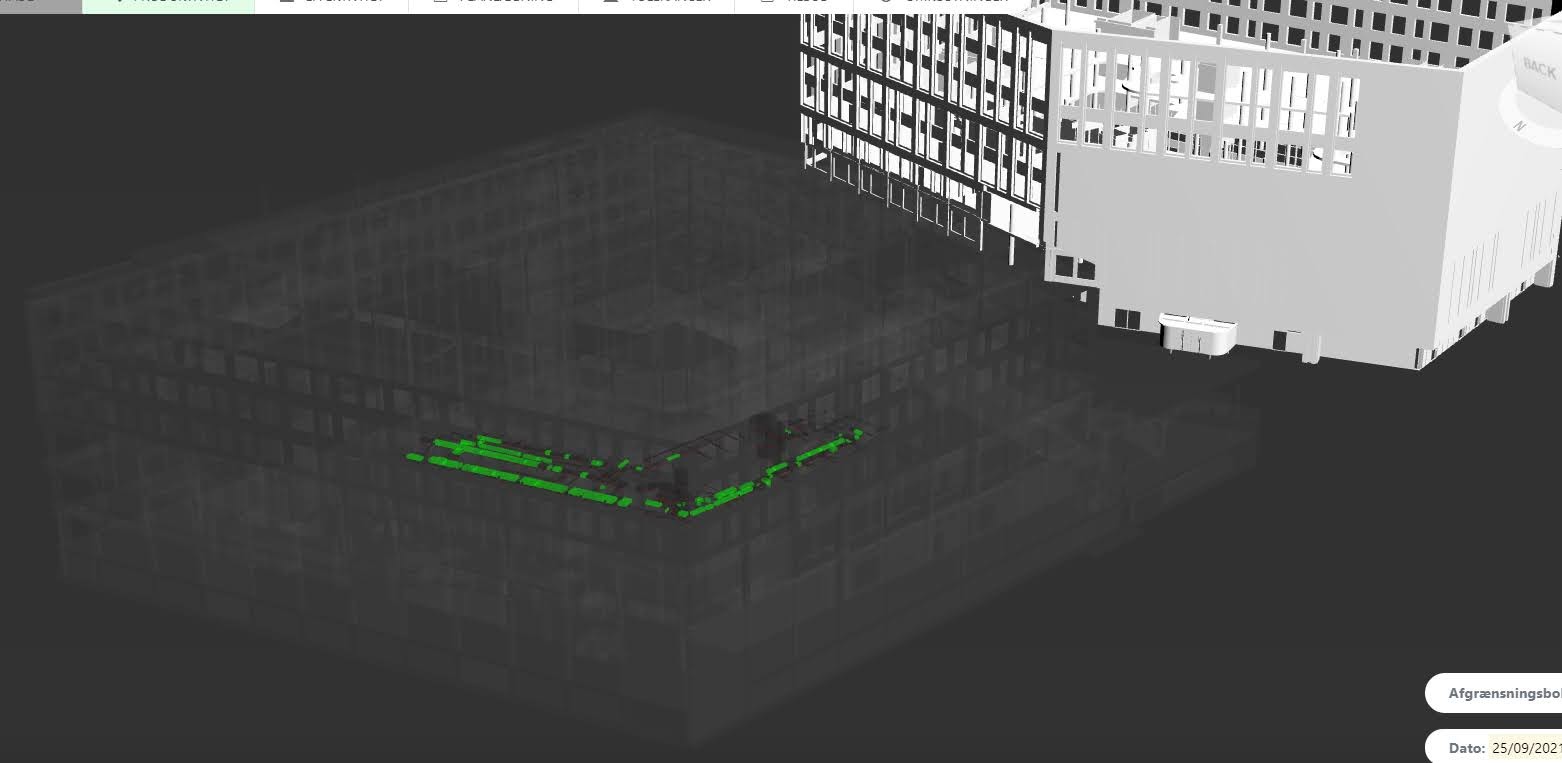
The 3D Visualizer, however, is the crown jewel of Sitemotion. In just 18 months, it has transformed from a crude prototype into the most advanced piece of software I’ve ever written.
Core Features
The 3D Visualizer empowers users with tools that revolutionize construction management. Here are some of its standout features:
- Upload IFC models from tools like Autodesk Revit.
- View multiple models simultaneously (e.g., piping, electrical, HVAC systems).
- Fully interactive 3D exploration.
- Integrated Gantt and Kanban boards.
- Link schedules with 3D geometries.
- Assign tasks to specific layers or model elements.
- Auto-schedule tasks and manage slack times.
- Monitor project progress and receive warnings for delays.
- Perform completeness calculations using Point Clouds.
- Generate visual reports for payment quotes, early warnings, statistics, and more.
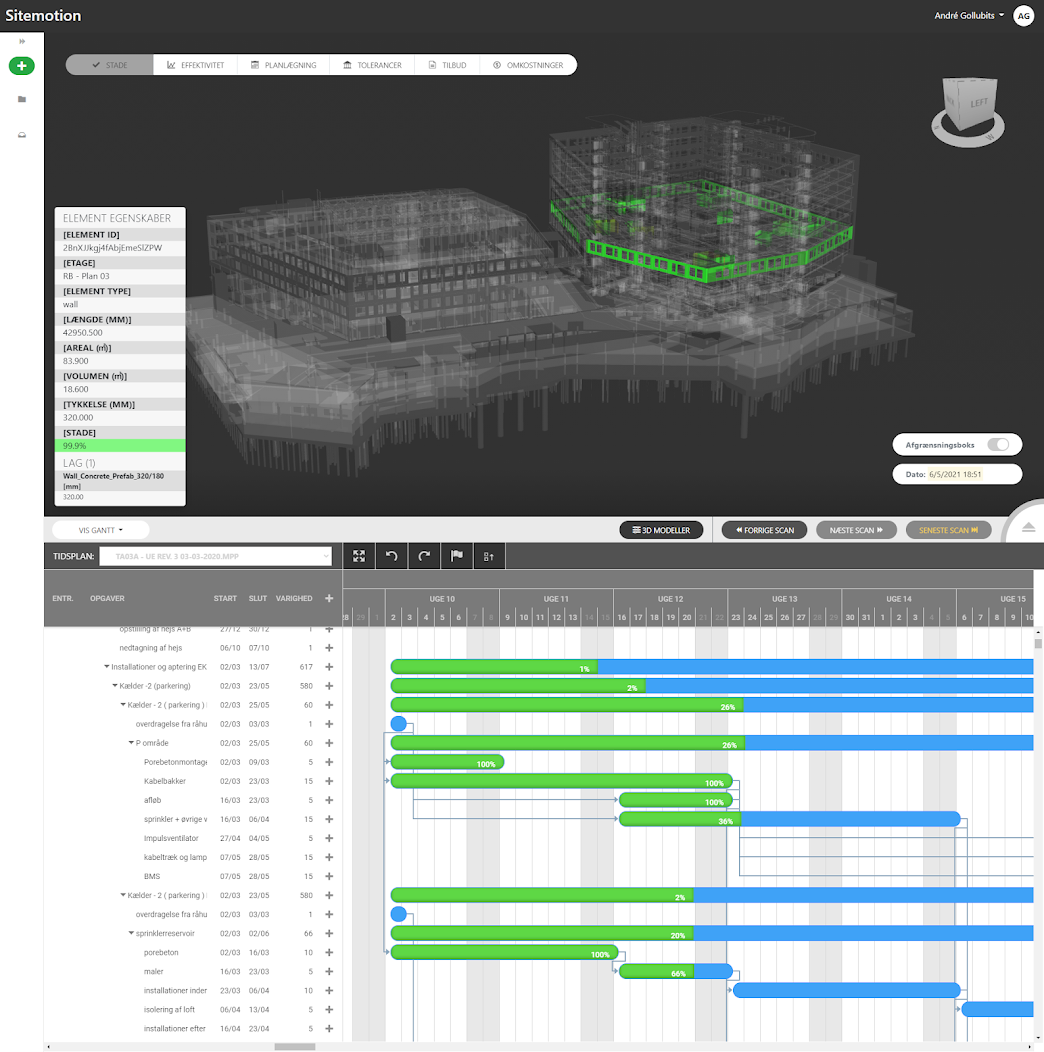
In essence, the 3D Visualizer processes Point Clouds to provide real-world, real-time progress reports on the completeness of BIM elements. This data is invaluable, offering insights for payments, quality assurance, and early problem detection.
Exploring the tech stack behind Sitemotion
Building Sitemotion was a collaborative effort, combining powerful frameworks, libraries, and in-house solutions. Here’s an inside look at the technologies we used and how they shaped the 3D Visualizer:
Laravel (with bundled Bootstrap)

When choosing a web framework, we wanted something future-proof that wouldn’t require reinventing the wheel. Laravel turned out to be a perfect fit. With its robust ecosystem and built-in tools, it enabled us to quickly set up the essentials like login systems, roles, permissions, and middleware.
Another bonus? Laravel came bundled with Bootstrap, a CSS framework I’d worked with before. This made front-end design a breeze, especially with the guidance of our experienced UX designer, who had already prepared mockups for every page. Having those designs upfront really sped up development.
XState: Managing Complexity with State Machines

XState was introduced later in the project, just before merging the 3D Visualizer into the main Laravel application. Initially, we relied on vanilla JavaScript and jQuery to handle interactions, but the growing complexity of features made this approach unsustainable. We needed a more structured way to manage the application’s state—enter XState.
XState allowed us to control large amounts of data and ensure that different buttons behaved correctly depending on the context (e.g., what was selected on the screen or which view the user was in). While it took time to understand how XState worked, its integration with THREE.JS turned out to be seamless, enabling a much more intuitive user interface.
THREE.JS: Bringing 3D Models to Life

THREE.JS was arguably the most exciting part of the tech stack. This JavaScript library made it possible to render and manipulate 3D models directly in the browser. While the learning curve was steep, experimenting with THREE.JS was endlessly rewarding.
With THREE.JS, we could do everything from changing the color of individual 3D elements to loading complex models in GLTF or OBJ formats. One of the biggest challenges was optimizing massive 3D models, like a 2.5 GB Revit file, to run smoothly in the browser. Techniques like simplifying geometry, managing rendering priorities, and dynamically loading assets were critical to achieving good performance.
The “Sitemotion Backend”: Crunching the Numbers
The backbone of Sitemotion’s 3D Visualizer is what we jokingly call the “Sitemotion Backend.” Written in Python, this in-house application handles all the heavy lifting—comparing 3D BIM models with point cloud data from sources like drone scans or even Boston Dynamics’ SPOT robot.
SPOT: The Robotic Assistant
One of the coolest tools we’ve integrated into Sitemotion is Boston Dynamics’ SPOT robot. Equipped with a lidar scanner, it collects point cloud data autonomously on construction sites. I’ll share more about how we unleashed SPOT on a construction yard later in this post.
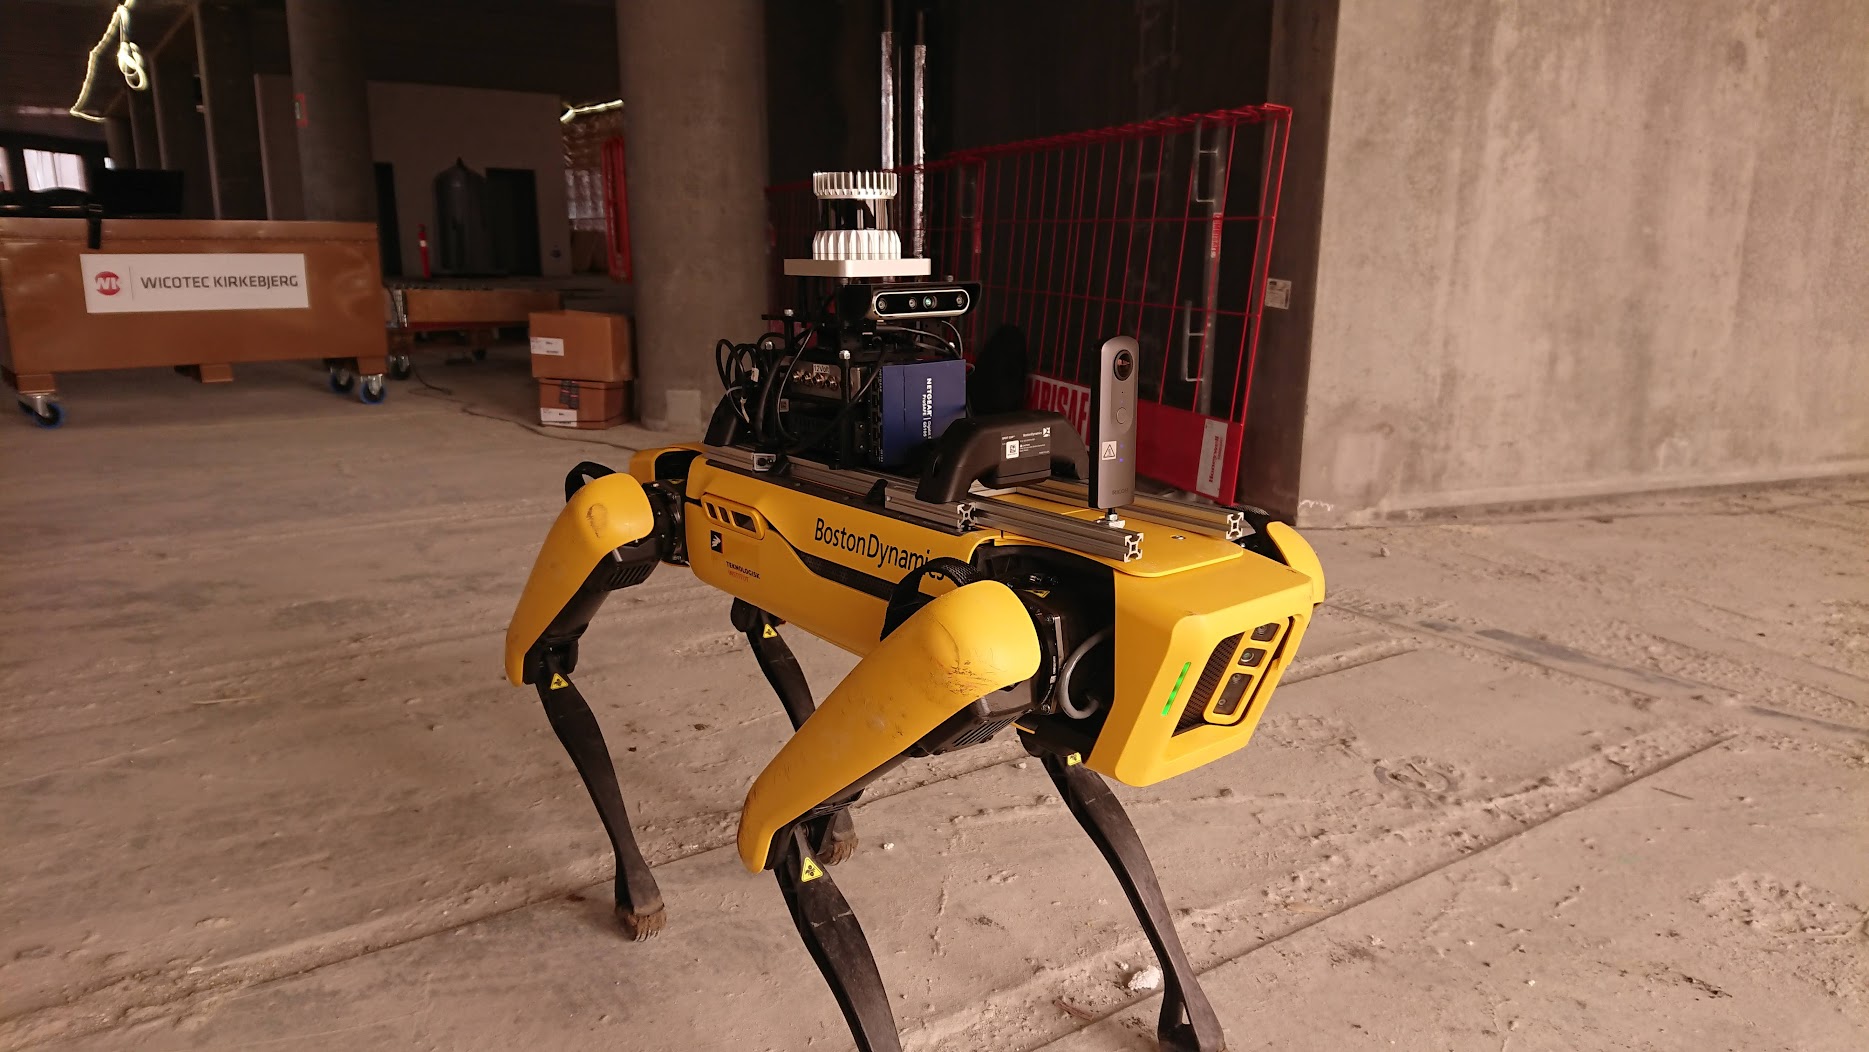
The backend’s calculations are incredibly powerful. For example, it can analyze a 3D model from Autodesk Revit and a corresponding point cloud to determine how much progress has been made on a construction site. By linking this data to a Kanban board, users can easily track whether a project is ahead or behind schedule—all with minimal human input.
However, creating such a powerful system was no easy feat. One of the biggest challenges the Python developers faced was the time it took to run the calculations. As we started processing larger datasets, runtimes became a serious issue. It wasn’t uncommon for the office computers to spend up to 48 hours crunching numbers.
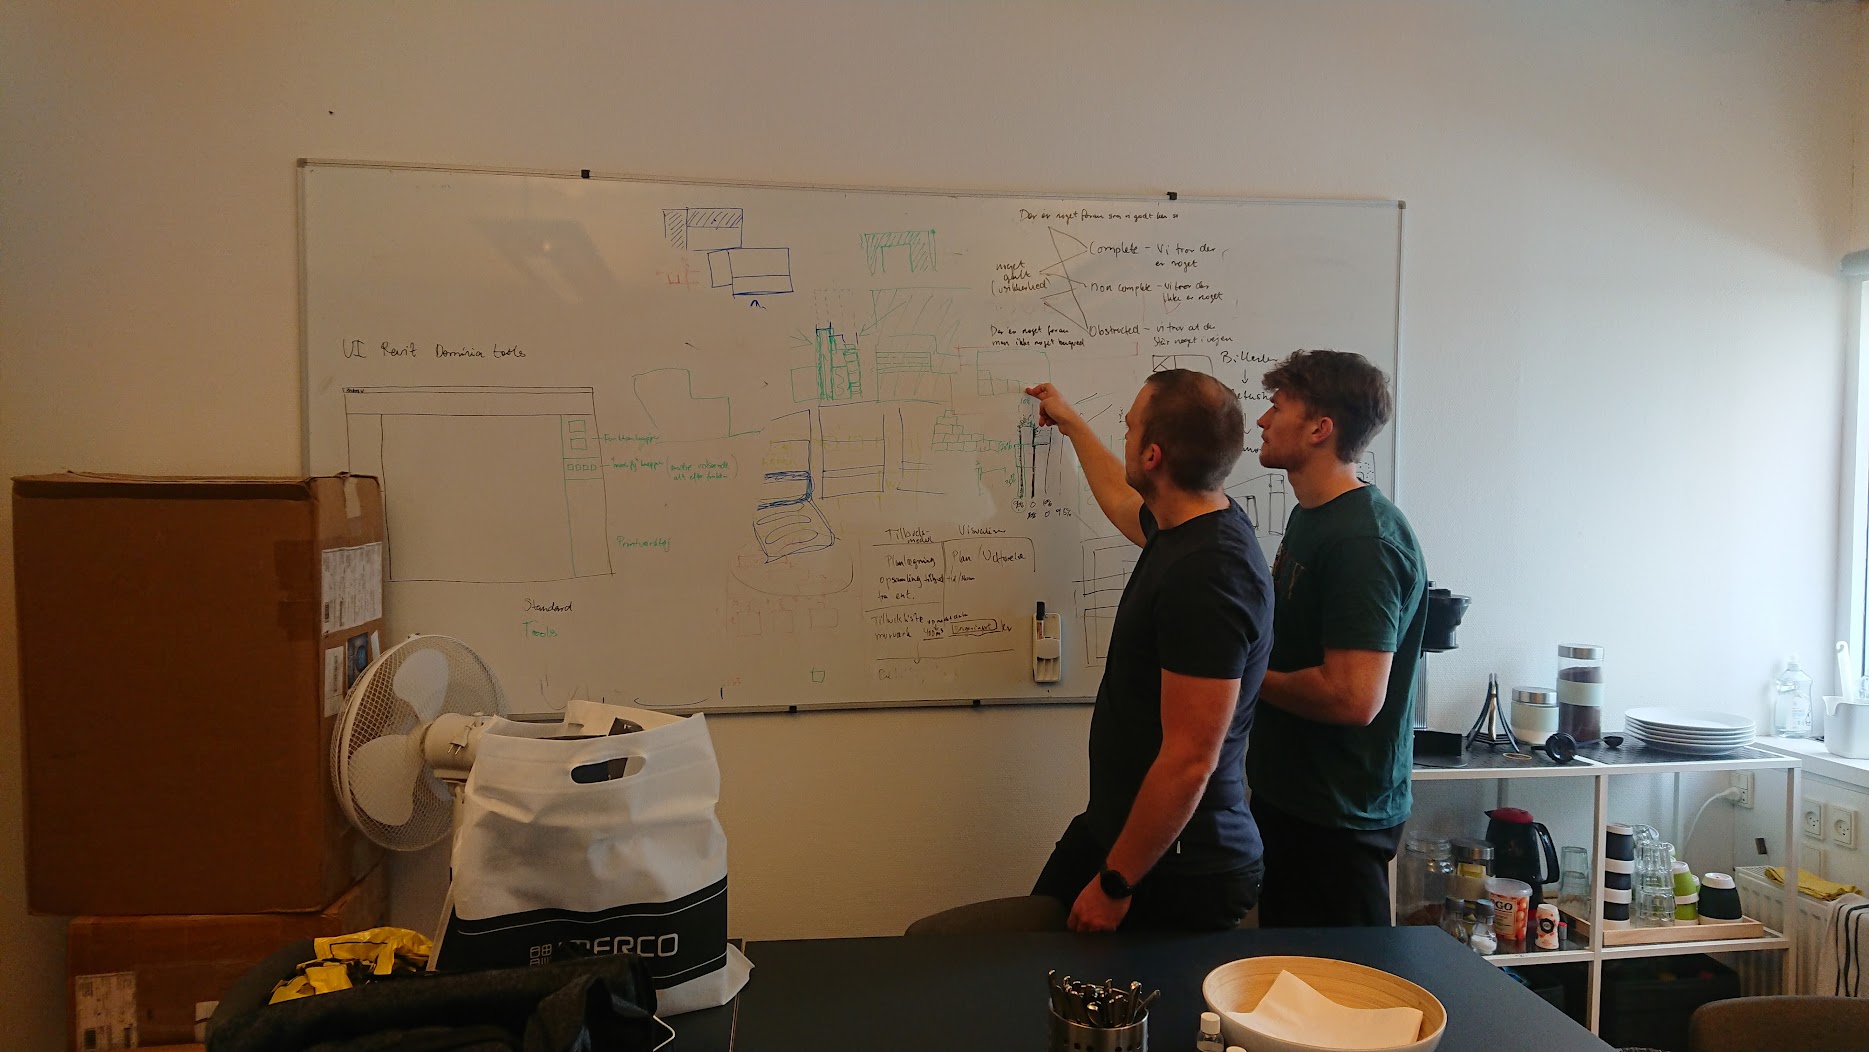
The strain on the hardware was a sight to behold. I remember a particular office laptop—affectionately nicknamed "The Workhorse"—that would run for days on end without a break. Its fans roared like jet engines, and we joked that it deserved an honorary spot on the payroll.
These long runtimes also made debugging and testing incredibly challenging. Every tweak to the code required waiting hours (or even days) to see if the changes worked. But perseverance paid off. At one point, the team discovered a new approach to optimize the calculations—likely by leveraging parallel processing or refining algorithms—and cut the processing time in half.
The breakthrough was met with pure joy. Not only did it save hours of computation time, but it also brought a sense of relief and momentum to the project. Moments like these remind us why solving tough technical challenges is so rewarding.
New programming concepts
Building the 3D Visualizer has been a journey of growth and discovery, introducing me to programming concepts I had never tackled before. From managing complex user interactions with state machines to rendering 3D models efficiently in a browser, each challenge pushed my skills further. Here are a few key concepts I’ve encountered along the way:
State Machines: Structuring Interactions
State machines are a fundamental programming concept used to control behavior based on an object's current state. Imagine a simple light switch with two states: ON and OFF. If you introduce a dimming feature, the system gains additional states where specific actions—like adjusting brightness—are only possible when the light is ON.
For the 3D Visualizer, managing user interactions became increasingly complex as features were added. Hovering over a model, selecting an element, rotating the camera, or switching between different tools all required precise control. We needed a way to ensure users couldn’t trigger conflicting actions at the same time.
Enter XState, a JavaScript library for managing finite state machines. It allowed us to define eight distinct states governing behaviors like selection, measurement, and editing. This approach ensured that only relevant actions were available at any given time, reducing errors and making the UI feel fluid and intuitive.
3D Programming: Thinking in Three Dimensions
At first, 3D programming felt like an entirely new world. Unlike traditional front-end development, where you manipulate elements on a 2D plane (X and Y axes), working in 3D means introducing depth (the Z-axis), perspective, lighting, and camera movement—all of which require a new way of thinking.
Using THREE.JS, I learned how to load, position, and manipulate 3D models in a browser. One particularly tricky challenge was handling clipping planes, which allow you to slice through a model to see inside. Getting the clipping planes to align correctly required precise mathematical calculations and a deep understanding of how THREE.JS handled transformations.
Another challenge was performance optimization. Large 3D models from Autodesk Revit, often several gigabytes in size, needed to be loaded efficiently without crashing the browser. This led me to explore new techniques like level-of-detail rendering, frustum culling, and binary space partitioning, all of which help improve rendering speed without sacrificing quality.
One of our most effective optimizations was introducing Ghost Models. This in-house solution allowed us to convert complex BIM models into a lightweight, simplified version—essentially reducing an entire building to a single 3D object. This drastically improved performance while maintaining visual context. Since many projects involved three or more highly detailed models, we implemented a system where users could interact with one model at a time while rendering the surrounding models as greyed-out "Ghost Models." This provided a smooth and responsive experience without overloading the browser.
Materials and Shaders: Making 3D Objects Look Real
One of the most fascinating aspects of 3D programming is controlling how objects appear. In THREE.JS, every 3D object has a material, which determines how it interacts with light. Different material types can simulate plastic, glass, metal, or even glowing surfaces.
Early on, I assumed that materials were unique to each object—only to find out the hard way that they could be shared. I once adjusted the color of a single wall, only to watch in horror as the entire 3D model changed color! The fix? Cloning materials to ensure each object had independent control over its appearance.
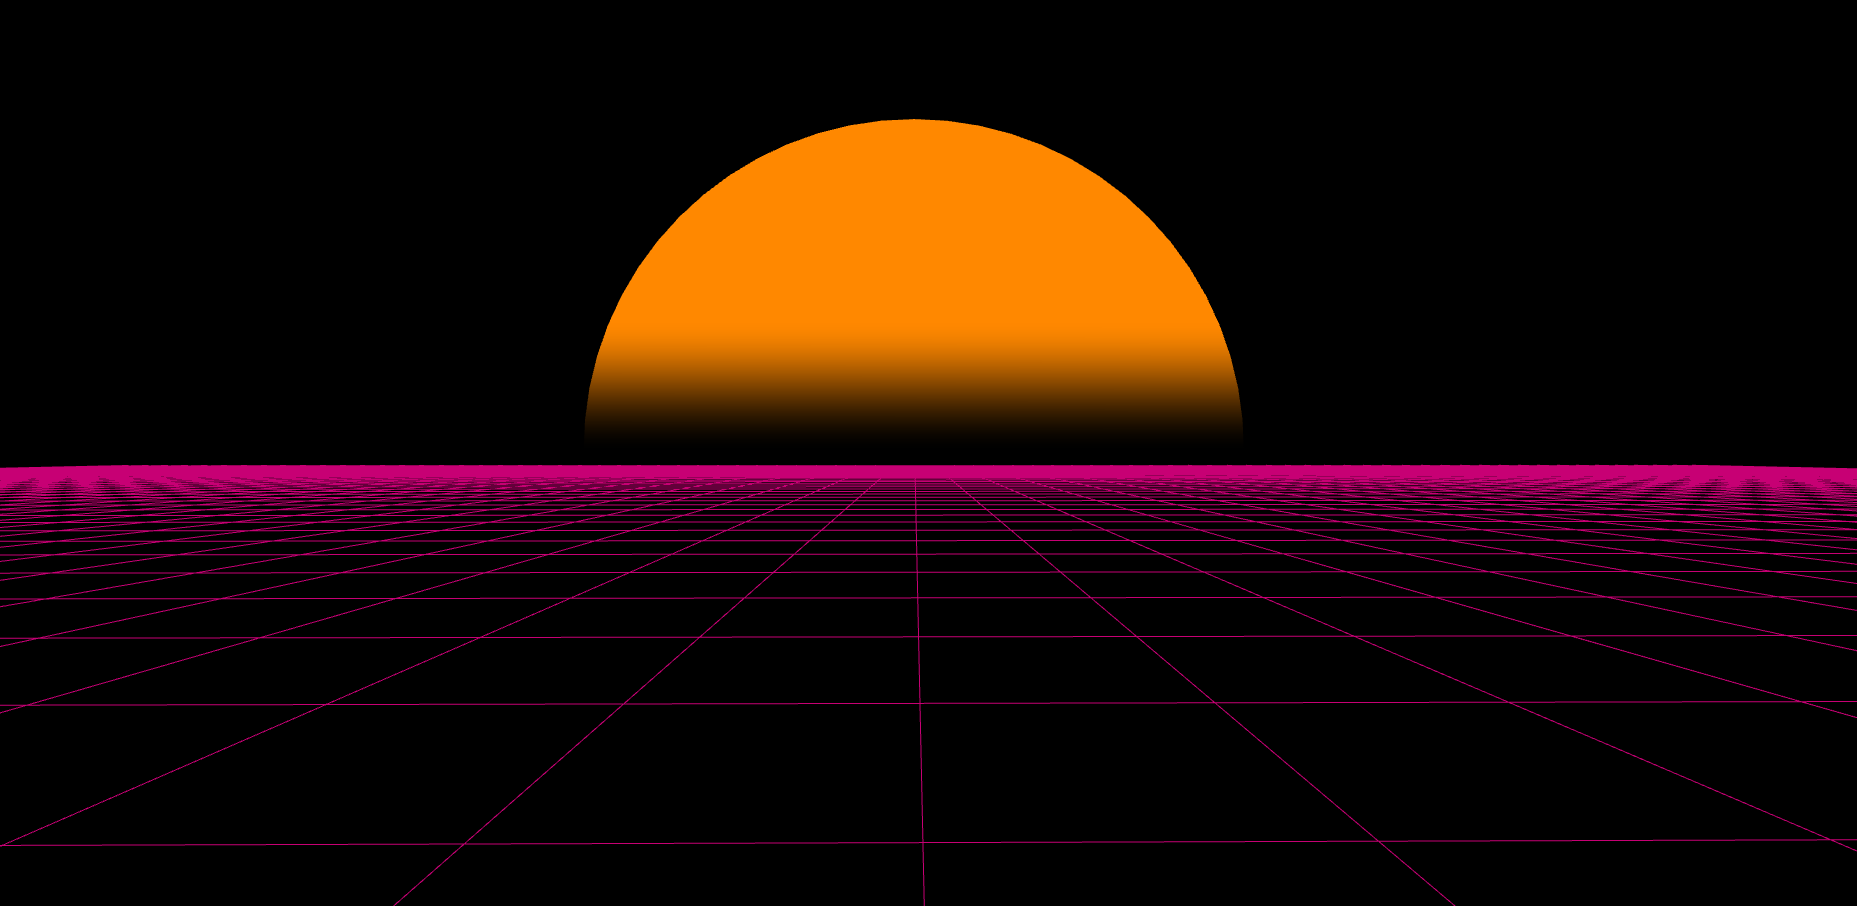
Then there are shaders—small programs that control how pixels are rendered. While I haven’t used shaders for Sitemotion (yet), I experimented with them in a personal project: a retro THREE.JS synthwave grid. By manipulating vertex and fragment shaders, I made the neon grid appear as if it were endlessly scrolling forward—just like in old-school arcade games.
The future of Sitemotion
The 3D Visualizer grows more sophisticated with each passing week, and I’m eager to tackle the challenges that lie ahead. The past 18 months have shown me that adaptability and a hunger for learning are the keys to growth.
Six months ago, I couldn’t have imagined building a 3D application for web browsers. Today, it’s a reality. Who knows what I’ll be capable of six months from now?
Never stop learning. Thanks for reading this deep dive into my work—hopefully, you found something useful or inspiring along the way!